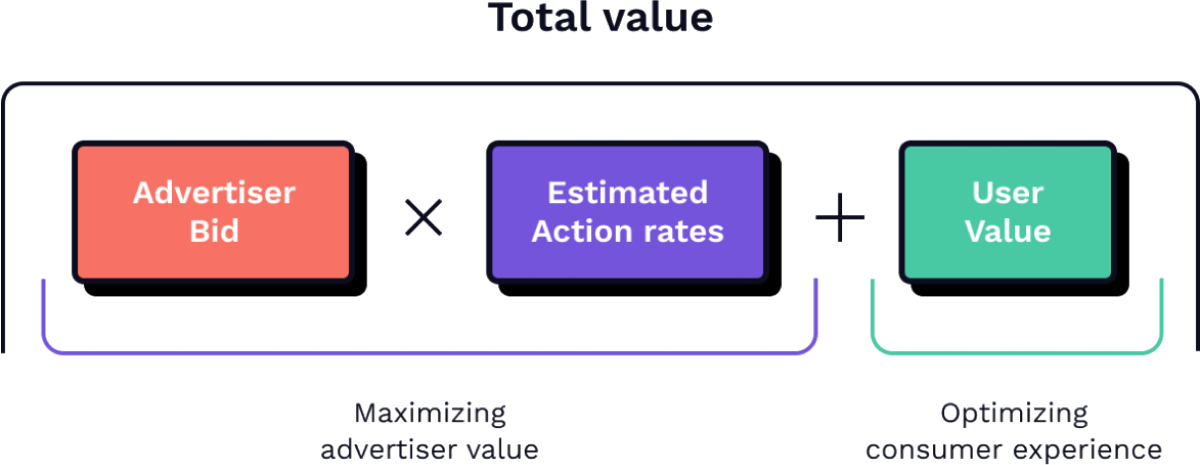
When you set up a Facebook ad campaign, you have access to many tools and settings to help control your Facebook ad costs. You can look at the cost of Facebook ads in two ways: how much you want to spend on a campaign or by how much you want to spend per result.
You can directly control the amount you want to spend on a Facebook ad campaign, for example $5 per week or $5,000 per week, but you can’t directly control the cost of each result you get (for example a purchase, a download, or a click). Facebook has tools to help you control the cost per result to a degree, but there is no telling if you will consistently get results for your desired cost.

Facebook’s goal is to increase the time their users spend on Facebook and too many bad ads in users’ news feeds will contribute to users leaving. So if you have an ad that doesn’t perform well because people don’t like it, you will have to pay more to Facebook for them to deliver it to their users. On the other hand, if you create an ad people like, you won’t have to pay as much for the ad because you’re helping make Facebook a better experience for their users. Facebook uses a number of different methods to measure user value, two of them being the ratio of negative to positive reactions to your ad and the number of users who hide or report your ad.
The other factor is the estimated action rate which is a measurement of expected advertiser value. Facebook mostly measures this based on how well your ad is achieving the objective you set for it. Typically, if an ad is performing well, it means the user likes the ad.

All this processing happens under the hood. As an advertiser, all you need to do is set the budget for your campaigns and keep your focus on finding the right audiences for your product and making the best ads you can. Doing these two things well will drive the cost of your Facebook ads down.
Granted that there are unique factors that determine your Facebook ad costs, we analyzed several hundreds of millions of dollars in Facebook ad spend to see how much Facebook ad costs on average.
Use our Facebook ad cost charts above to find the average cost of Facebook ads by your campaign objective.

CPM stands for cost per thousand impressions. The ‘M’ in ‘CPM’ is the roman numeral for 1,000 and since no other metric is measured per thousand, it is implied CPM is for impressions only.
CPM is calculated on Facebook by dividing your spend by impressions (not reach) and then multiplying that number by 1,000.
For example, if your spend was $5 and you got 2,000 impressions for that $5, your CPM was $2.50, which means it cost $2.50 to get 1,000 impressions (($5/2000)*1000)=$2.50).
A good CPM on Facebook really is dependent on who you’re targeting and how you’re targeting them, making it impossible for us to give you a number that holds any relevance for how you run your Facebook ads.
How most advertisers determine whether their CPM is good or not is comparing an ad or ad set’s CPM to their other ads or ad sets or even to their campaign or ad account average.
However, if you want a baseline Facebook CPM target, use our Facebook ad costs charts above with the same campaign objective you typically run to get an average. You can also ask your fellow advertisers what their typical CPMs are in your niche in our Facebook community for Facebook advertisers.
If you’ve noticed an increase in your Facebook ad CPMs, it could be for a wide variety of reasons including:
Yes, sometimes a higher Facebook CPM is due to just a bad day on Facebook. You’re probably already familiar with the wild swings in day-to-day performance of your Facebook ad campaigns and bad days do happen. You can use automated rules or Facebook automation software to automatically pause ads, ad sets, and campaigns that see a high CPM early in the day and automatically restart again the next day.
If you’ve been experiencing higher CPMs on Facebook for several days now, all you have to do is look at the reasons why your CPM might be higher and solve for them.
Here are five ways to lower your CPM.


